

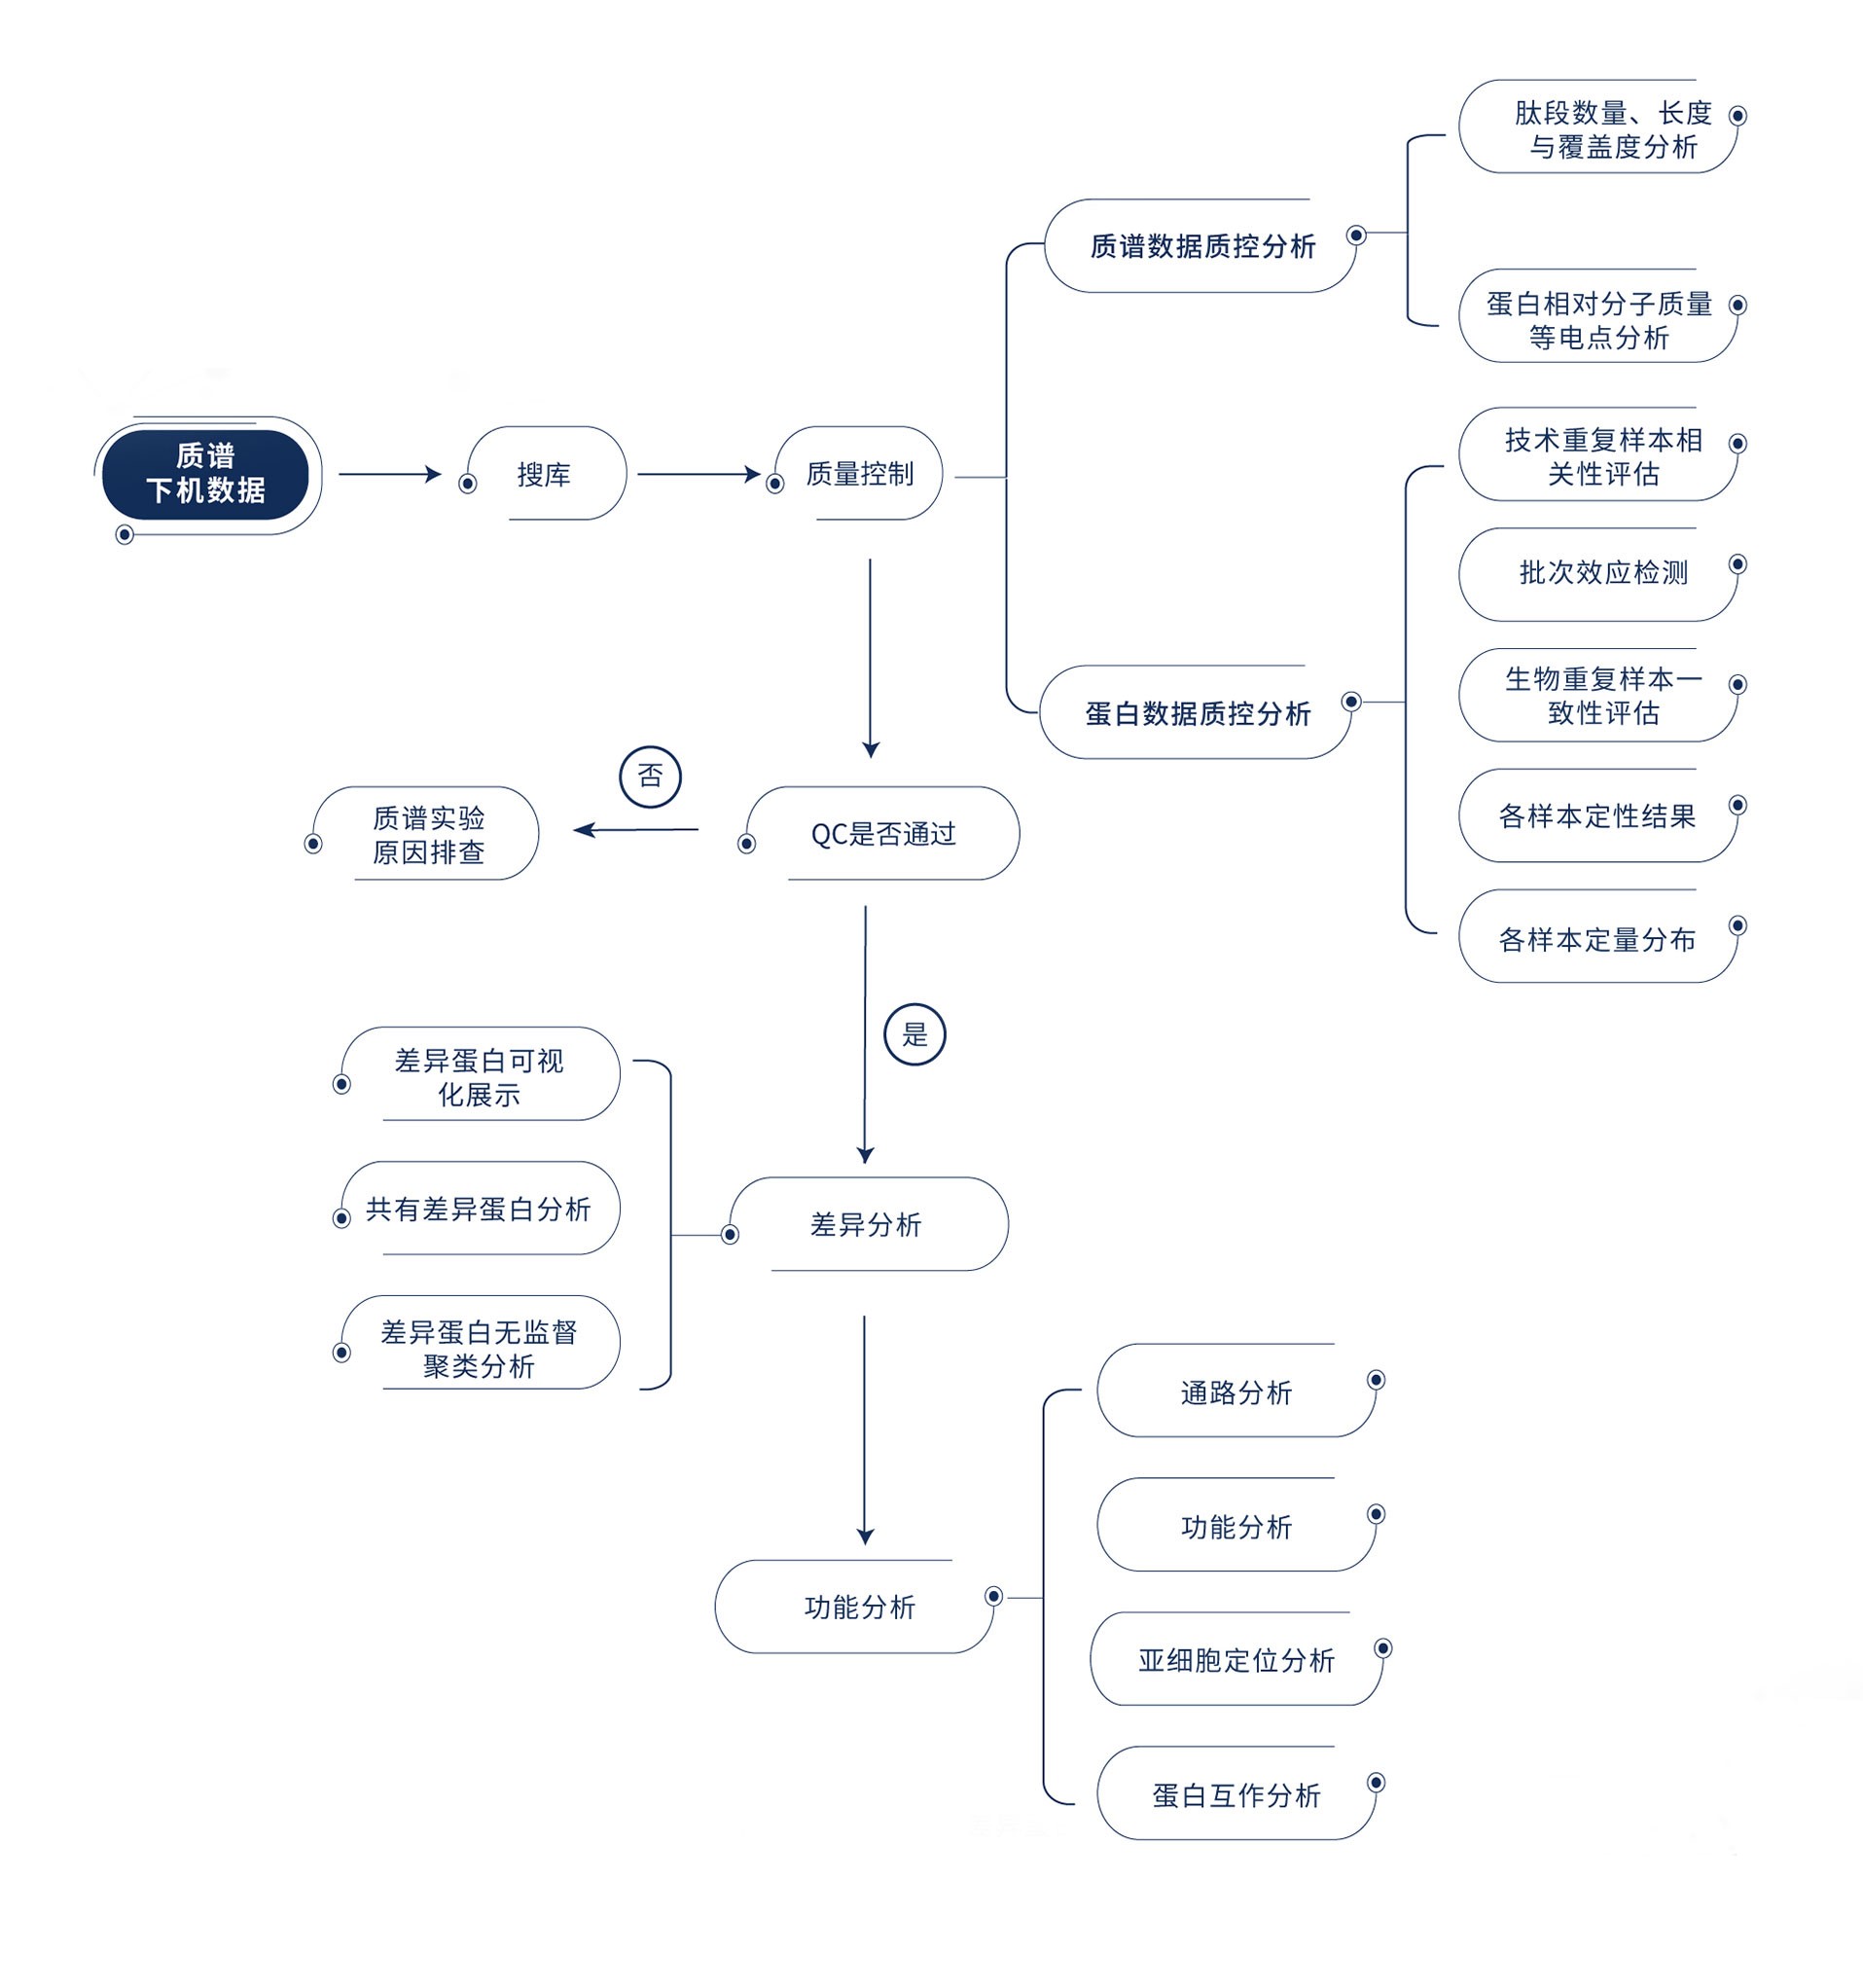
The content of the standard bioinformatics analysis of Westlake Omics is as follows.
Analysis content | Explain |
Analysis of quality control | Bar Plot, Density Plot, Correlation Heatmap, Correlation Scatter Plot,QC sample quantitative correlation analysis, Batch effect view |
Quantitative analysis | Heatmap |
Differential analysis | Volcano map,PCA; |
Function/pathway analysis | GO、KEGG、PPI |